シミュレーションは理論・実験に続く第三の科学的手法として、急速な普及をとげてきました。
シミュレーションと人間を結ぶ重要な手段に「可視化」があります。「百聞は一見にしかず」とも言われていますように、
人間は脳で理解する情報の大半を目から受け取っています。
本シンポジウムではシミュレーションにも資するコンピュータ可視化技術の最新動向を、日本・中国を代表する世界的な
研究者によって紹介します。
皆様のご来場を心からお待ちしています。
後援:文部科学省グローバル人材育成推進事業
告知ポスター(PDF)
シンポジウム詳細
日程
2013年 1月 16日(水)13時〜18時
場所
お茶の水女子大学(アクセスマップ)
理学部3号館2階会議室(キャンパスマップ 20の建物)
* 入場無料 *
* 事前登録不要 *
* 途中入退室可 *
13:00
開会のことば
伊藤貴之(シミュレーション科学教育研究センター長, 教授)
13:10-14:00
高橋成雄(東京大学, 准教授)
"Constrained Optimization for Aesthetic Design of Customized Maps"
|
Dr. Shigeo Takahashi is currently an associate professor in the Graduate School of
Frontier Sciences at the University of Tokyo, Japan. He received his B.S., M.S., and Ph.D.
in computer science from the University of Tokyo in 1992, 1994, and 1997, respectively.
His research interests include scientific visualization, geospatial visualization, visual
perception modeling, and geometric modeling. He is currently serving as an associate editor
of IEEE Transactions on Visualization and Computer Graphics, and served as a program committee
member for more than 30 visualization and graphics conferences such as IEEE Visualization,
EuroVis, IEEE Pacific Visualization, and Pacific Graphics. He received the Most Cited Paper
Award for Graphical Models (2004-2006) from Elsevier in 2007.
|
|
Abstract:
Customizing maps is an effective way of guiding our travels especially when we visit new cities.
Various commercially available guide-maps have been designed by professional illustrators while
they often fail to serve our own specific travel purposes. In this talk, we present approaches
for automatically composing customized maps by incorporating aesthetic criteria commonly employed
by map illustrators. This is accomplished by formulating such aesthetic criteria as constraints
on the map layout and then minimizing the associated cost function to fully optimizing the map
readability.
The primary tools of our constrained optimization approach are the linear programming technique
and its integer version. First we introduce the linear programming technique to disocclude
important routes and landmark buildings in 3D urban maps, so that we can fully facilitate travelers
to find they ways to the destinations while referring to the appropriate landmarks. Visually
plausible deformation of the 3D urban maps is obtained through the optimization of the cost
function that penalizes the displacement of geographic features together with the occlusions of
important landmarks. We then apply the mixed-integer programming technique, which is the integer
version of the linear programming technique, to explore several aesthetic design rules for
customizing 2D schematic metro maps. The placement of large annotation labels such as thumbnail
photographs are also optimized while aligning the metro lines along the octilinear directions.
We also provide various design examples of such customized maps to demonstrate the feasibility
of our approach.
|
14:00-14:50
小山田耕二(京都大学, 教授)
"Multivariate Visualization for Visual Analytics Environment"
|
Dr. Koji Koyamada is currently a professor of Institute for the Promotion of Excellence
in Higher Education, Kyoto University, Kyoto, Japan. He received a B.S., M.S. and Ph.D degrees
in electronic engineering from Kyoto University, Kyoto, Japan in 1983, 1985, and 1994, respectively.
From 1985 to 1998 he worked for IBM Japan. From 1998 to 2001 he was an associate professor at Iwate
Prefectual University. From 2001 to 2003 he was an associate professor at Kyoto University.
His research interest includes modeling, simulation and visualization.
He is an associate member of Science Council of Japan(2011-2016), a director of Visualization
Society Japan(2010-2012), a president of Japan Society of Simulation Technology (2010-2012).
|
|
Abstract:
Recently, multivariate visualization techniques attract more attention in visual analytic
environment since they are useful for hypothesis forming and testing and its application.
Multivariate visualization techniques are important in hypothesis forming and testing using
a large-scale simulation result. In general, a high-performance computer system generates
a multivariate volume dataset defined on different grids which include unstructured grids.
A hypothesis is often composed of dependent variables and an independent variable.
In the hypothesis forming, it is important to select an appropriate set of variables in
the coordinate space where the volume datasets are defined. For the selection, multivariate
volume visualization techniques are promising since we can easily find a location in which
multiple variables have a relation with each other. But, the development of such visualization
techniques is regarded as a challenging research in the visualization community since
the visibility sorting becomes difficult for multiple grids.
To solve the problem, we develop a technique for stochastic rendering, which can integrally
handle multiple objects including volumes and surfaces without visibility sorting.
To develop a sorting-free rendering algorithm, we revisit a brightness equation in the volume
rendering algorithm and reconsider the definition of opacity which is usually derived from a
user-specified transfer function. This leads to two approaches, object space approach and
image space approach. In the former one, we define a density function of emissive opaque particles.
According to the density function, we generate particles in a given volume dataset and project
them onto an image plane. Since we use an opaque particle, no visibility sorting is required.
In the latter approach, we regard the brightness equation as the expected value of the luminosity
of a sampling point along a viewing ray, and we propose a sorting-free approach that simply
controls the fragment rendering by using the evaluated opacity value to calculate a rendered image.
To confirm the effectiveness of our technique, we applied it to several numerical simulation
results showed the performance results and demonstrated the application of our technique to
making clear the relation between the fishery and the ocean flow in the Pacific ocean.
|
14:50-15:40
Dr. Shixia Liu (Microsoft Research Asia, China)
"Interactive, Topic-Based, Visual Text Analytics"
|
Dr. Shixia Liu is a lead researcher in the Internet Graphics Group at Microsoft
Research Asia. Before she joined MSRA, She worked as a research staff member and research
manager at IBM China Research Lab, where she managed the departments of Smart Visual Analytics
and User Experience. Her research interests include interactive, visual text analytics and
interactive, visual social analysis, and visual search log analysis. She is the program
co-chair of VINCI'2012. She is also the guest editors of ACM Transactions on Intelligent
Systems and Technology, and Tsinghua Science and Technology. She is in the program committee
of PacificVis, ACM Multimedia, SDM, IUI, VINCI, IVAPP, and PAKDD.
|
|
Abstract:
Businesses use text documents to communicate with their shareholders, share knowledge within
the enterprise, coordinate activities among employees, and track business processes.
As a result, analyzing text documents has become increasingly an important part of decision
making in large corporations and small businesses. For this reason, it is attracting the attention
of the visual analytics research community and will continue to do so in the future.
However, analysis of textual content is non-trivial for two reasons. First, sophisticated
text analytics is often required to derive meaningful insights buried under the mountains of
text documents. Unfortunately, text analytic results are often abstract and complicated, and
difficult for average users to comprehend, let alone leveraging them effectively.
Second, today’s text analytics are far from being perfect. Users may have questions about or
want to verify the derived insights. Nonetheless, few visual analytic tools support such user tasks.
To tackle these challenges, we have developed several topic-based visual text analytics techniques.
In this talk, I’ll present some of our research results and use them to exemplify how we solve the
challenges in real-world applications. Specially, I’d like to introduce 1) TIARA that uses an
enhanced topic modeling engine that aims to provide users with a meaningful, time-sensitive
topic-based summary; 2) An interactive visual analysis tool called TextFlow to help users
analyze how and why the correlated topics change over time; 3) TextPioneer for identifying
the topics in a text corpus which lead the similar topics in other corpora. In these work,
we aim to demonstrate how to best combine and leverage state-of-the-art technologies from
multiple fields to help people analyze large collections of text and make decisions.
|
休憩
16:00-16:50
Prof. Xiaoru Yuan (Peking University, China)
"Visualization with Collabrative Input"
|
Dr. Xiaoru Yuan is a faculty member in the School of Electronics Engineering and
Computer Science and vice director of Information Science Center at Peking University.
He received Bachelor degrees in chemistry and law from Peking University, China, in 1997 and 1998,
respectively. He received the Ph.D. degree in computer science in 2006, from the University of
Minnesota at Twin Cities. His primary research interests are in the field of visualization with
emphasis on high dimensional data visualization, high performance visualization for large data,
and novel visualization user interface. His co-authored work on high dynamic range volume
visualization received Best Application Paper Award at the IEEE Visualization 2005 conference.
He serves as the chair (2012-13) of CCF YOCSEF. For more information,
visit http://vis.pku.edu.cn
|
|
Abstract:
Visualization can effectively harness human intelligence with the power of computing.
More recent advances include the introduction of collaborative efforts of group of users
through crowd sourcing. In this talk, I will first discuss a new strategy for graph drawing
we developed recently. It utilizing layouts of many sub-graphs supplied by a large group of
people in a crowd sourcing manner. The Algorithms are based on Laplacian constrained distance
embedding to merge subgraphs submitted by different users, while attempting to maintain
the topological information of the individual input layouts. Compared with other existing
graph layout algorithms, our approach can achieve more aesthetic and meaningful layouts with
high user preference. Then I will cover some of our ongoing work to exploit online
collaborative efforts for constructing insightful visualization from social media
(Weibo, Chinese counterpart of Twitter).
|
16:50-17:40
藤代一成(慶応義塾大学, 教授)
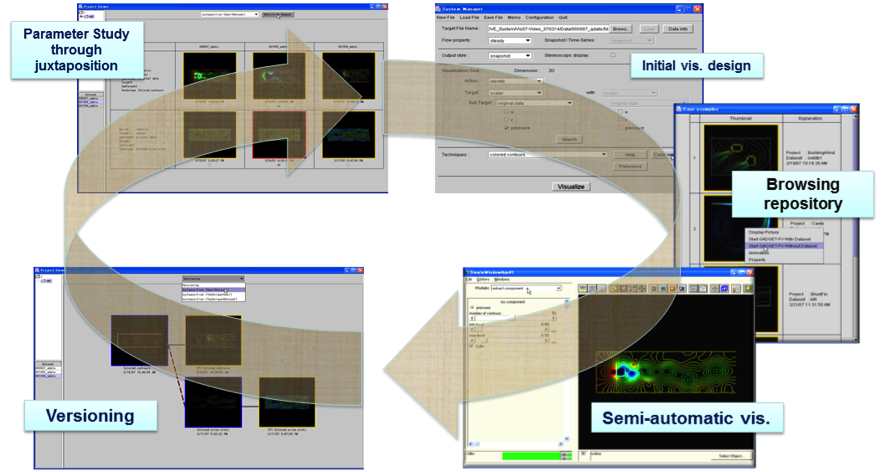
"Managing Scalable Visualization Lifecycle"
|
Prof. Issei Fujishiro is currently a professor in Department of Information and
Computer Science, Faculty of Science and Technology, Keio University. He received his
Master of Engineering in information sciences and electronics from University of Tsukuba
in 1985 and his Doctor of Science in information sciences from The University of Tokyo in 1988.
His major research interests include volume graphics, visualization lifecycle management,
and multi-modal information display. Prof. Fujishiro has served on the editorial boards
for IEEE Transactions on Visualization and Computer Graphics (1999-2003), International
Journal of Image and Graphics (2001-2002), and Computers and Graphics (2003 to date).
He chaired 15 international conferences, including Program Chairs for IEEE/EG Volume
Graphics 2003/2005 and IEEE Pacific Visualization Symposium 2008, and a Conference Chair
for IEEE SMI 2006 (Matsushima), and served on conference/program committees for more
than 100 related international conferences. Also, he is currently serving as a vice
president for the Society for Art and Science and on the board of representatives for
Institute of Image Electronics Engineers of Japan.
|
|
Abstract:
Maintaining scalability through cooperation with smart software is an essential factor
for establishing next-generation, exploratory visualization environments. In this talk,
we will describe how our cooperative visualization lifecycle management system,
called VIDELICET, succeeds to provide the users with its scalable visual analysis,
with a particular focus on the following three points. (1) The VIDELICET system builds
upon a visualization ontology to organize its case repository, which is intended to
collect successful visual analysis examples in the past cooperation.
The “design-by-examples” principle allows the users to browse the repository to
retrieve promising visualization workflows optimized to their objectives, with which
even novice users can expeditiously kick off their visual analysis. (2) A hierarchical
provenance model has been adopted to enable the users to record, trace and re-utilize
their visual exploration workflows coupled with acquired knowledge as their sharing
provenance resources. Condensed display of the version trees makes it possible for
them to find primary visualization results at a glance and to judiciously determine
further course of visual analysis in the future. (3) Visualization-related parameter
tweaking is a tedious and time-consuming task for most users. The VIDELICET employs
differential topology-based field data analysis tools, which can suggest proper
parameter values for transfer functions, viewing, illuminations, and the like for
performing comprehensible visualizations in a semi-automatic way.
|
17:40
閉会のことば